Bulletin
The bulletin is a report, issued regularly by the NC3 Threat Observatory Platform (NC3 TOP), about the occurrence of emerging cyber threats. It aims to be a public source of reference on the latest threats and attack techniques for a non-technical audience. The bulletin is released quarterly and the reported information is structured according to the NC3 threat conceptual model. The information about emerging threats is described along the pathway described by the model, i.e., considering two main dimensions :
- The hazard and threat dimension, which describes the elements that constitute the attack process; it consists of an agent, an offensive means (e.g., an artefact, a specific technique) and a transfer mode to exploit or to implement the threat;
- The victim dimension, which describes the elements that characterise the processes that may lead to an impact; it describes how the attacker can reach (Internal Transfer Pathway) the IT target and can generate an impact, i.e., the gain for the attacker and the loss for the victim. (e.g., theft of sensitive data).

The two dimensions have in common one element called the **point of access**. It can be an IT system, a piece of hardware or any other type of item that can establish a functional connection between the threat agent and the victim. And it is characterised by an exploitable weakness (e.g., a flaw, a backdoor, etc.) which enables the attacker to penetrate the cybersecurity perimeter of the victim. As cyber-threats are constantly evolving to adapt to technological changes and protection measures, the NC3 TOP focuses on the most significant new attacks detected during the reporting period. The relevance of the emerging threats is determined considering the following criteria:
- The number of attacks that use the same techniques or exploit the same vulnerabilities;
- The number of attacks, performed by specific organised groups;
- The level of persistence of the attack, i.e., the ability of the attacker to remain hidden in the victim's environment;
- The link with known "Advanced persistent threats" (i.e. APTs, a type of complex persistence-enabled attacks) that are usually carried out by technically skilled groups such as those backed by a nation-state or organized crime.
NC3 bulletin provides support to business leaders to evaluate the threat context in which they operate, and help them to take decisions related to limiting the possible impact of these threats on their organisations. This should be particularly valuable in situations such as arbitrages for budget allocations aimed at security spending. Finally, the NC3 TOP bulletin should be helpful to end-users who want to monitor emerging threats. It will contribute to increase their situational awareness, which may allow them to implement prevention and protection measures relevant in their local context. In this sense, the bulletin aims to transform highly technical data into information supporting strategic decision-making processes concerning the definition or the choice of protection and prevention measures.
Source of data and information
The Bulletin is presently built from the data available in the public MISP community also known as MISPPRIV. More details can be found on this page (https://www.misp-project.org/communities/). MISP is a threat intelligence platform for gathering, sharing, storing and correlating Indicators of compromise of targeted attacks, threat intelligence, financial fraud information, or vulnerability information. Considering its extensive use and large number of users, it can be regarded as a reliable observation system on the main emerging threats. However, various external sources are used to enrich or validate the data points extracted from MISP, among which MITRE ATT&CK, MITRE CVE, and Malpedia.
Legend
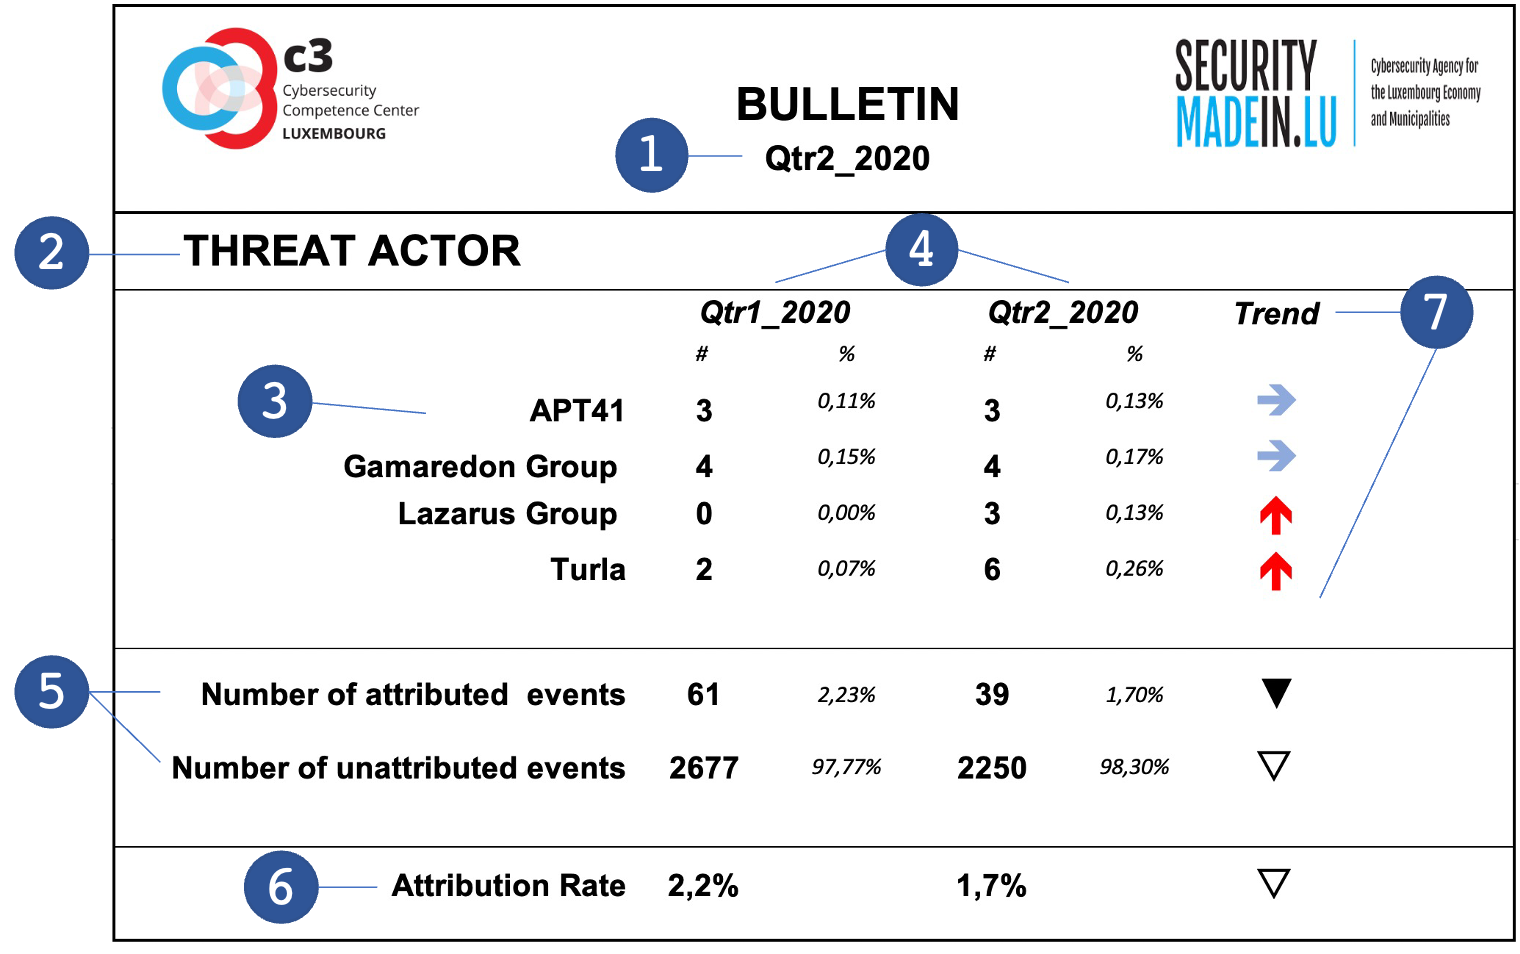
For each dimension of conceptual model, a table reports the main indicators of the year. The following figures illustrate the main characteristics of each table:
- Quarter covered by the present Bulletin
- Dimension of the model described in the table
- Entities or items identified as the most prevalent during the quarter covered by the Bulletin
- Number of items and percentage relative to the total number of items in this category
- Total number of attribute and unattributed items, where “attributed” means that the corresponding event can be linked with an item of the Dimension
- Rate of attribution showing the proportion of events that can be attributed relatively to the overall number of events
- Comparison with the previous period and corresponding trend
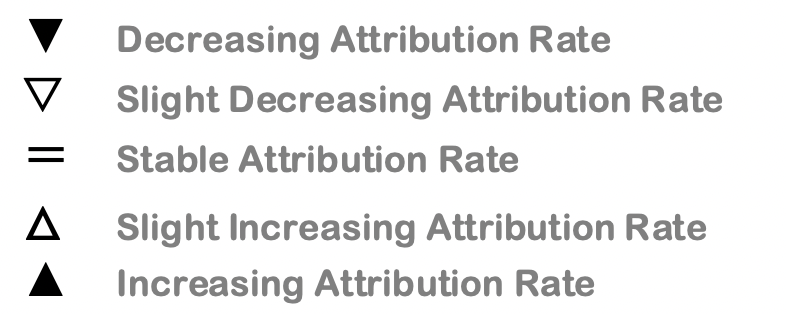
The following legends illustrate the graphics symbols associated to quarterly trends.
Trend legend

Attribution rate legend
Year 2020
Year 2021
Year 2022
Year 2023
| Coming soon! |